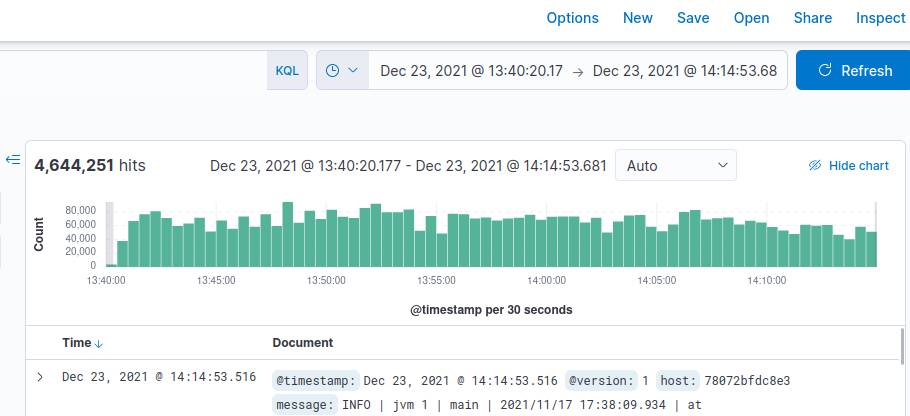
The article describes how to apply ELK-Stack functionality to SAP Commerce (Hybris) for a local environment. I do not recommend this manual as presented here for any production purposes.
If you just want to get already configured docker containers with ELK-stack, see the instructions at the end of the page.
In short, we will use the solution based on docker-elk which based on the official Docker images from Elastic:
1. Prepare your local environment
Make sure you have installed the software below:
- Docker Engine version 17.05 or newer
- Docker Compose version 1.20.0 or newer
If you use Linux, make sure your user has the required permissions to interact with the Docker daemon.
Create the docker group.
1 | sudo groupadd docker |
Add your user to the docker group.
1 | sudo usermod -aG docker $USER |
2. Get ELK-Stack
Clone the elk repo:
1 | git clone git@github.com:deviantony/docker-elk.git |
3. Give more memory to Logstash
It will help us to avoid out-of-memory exception, because Hybris logs could be large.
Open docker-compose.yml, find the section logstash.environment.
Change the LS_JAVA_OPTS from:
1 | environment: |
to:
1 | environment: |
4. Add path to hybris logs
Open docker-compose.yml, find the section logstash.volumes.
Add your hybris log path:
1 | volumes: |
5. Configure logstash
Open logstash/pipeline/logstash.conf
In the section input add new section file.
Before:
1 | input { |
After:
1
2
3
4
5
6
7
8
9
10
11
12
13 input {
beats {
port => 5044
}
tcp {
port => 5000
}
file {
path => "/var/log/hybris/*.log"
start_position => "beginning"
}
}
In the section filter add your custom filter:
1 | filter { |
6. Run containers
Start services locally using Docker Compose:
1 | docker-compose up |
You can also run all services in the background by adding the -d flag.
7. Add data
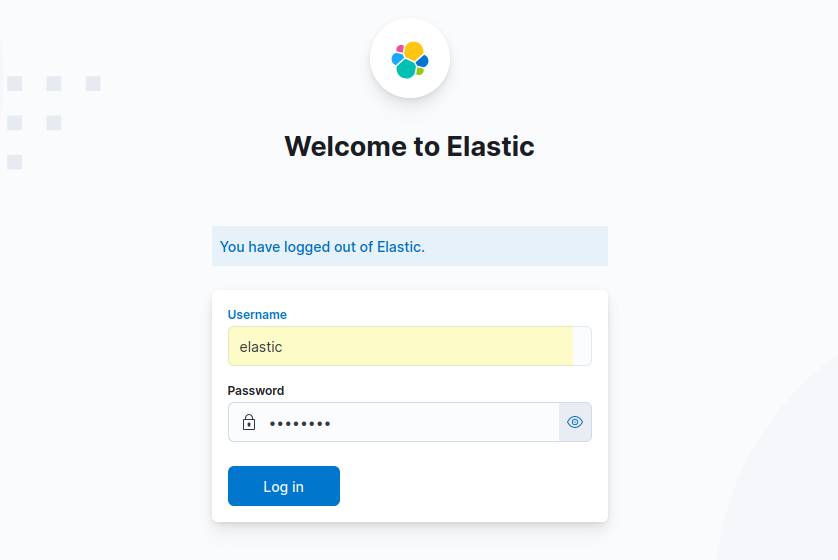
Give Kibana about a minute to initialize, then access the Kibana web UI by opening http://localhost:5601 in a web browser and use the default credentials to log in:
1 | user: elastic |

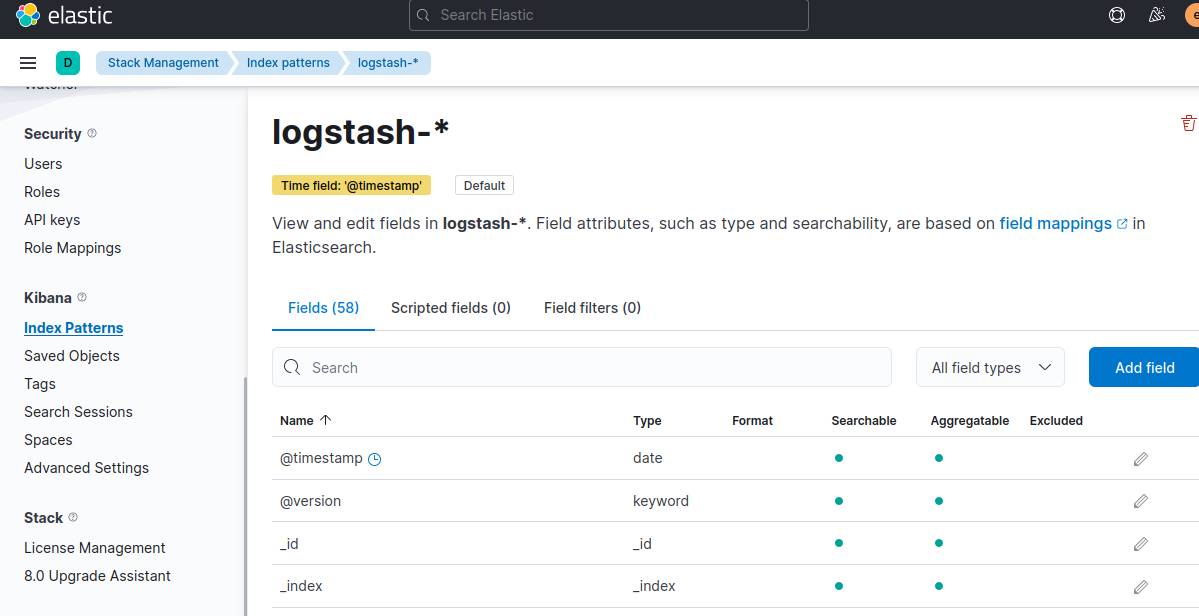
Navigate by the left sidebar to Managment/Stack Management/Index Patterns. You will be prompted to create an index pattern. Enter logstash-* to match Logstash indices then, on the next page, select @timestamp as the time filter field. Finally, click Create index pattern and return to the Discover view to inspect your log entries.

Index may take time, because hybris logs usualy aren’t small.
Another easy way
Just use my preconfigured version of ELK-Stack for SAP Commerce.
- Clone the repository
1
git clone https://github.com/AARomanov1985/ELK-plus-SAP-Commerce-Hybris
- Set your hybris_log path in docker-compose.yml in the section logstash.volumes:
1 | volumes: |
For exmaple it could be:
1 | volumes: |
- Run containers:
1 | docker-compose up |